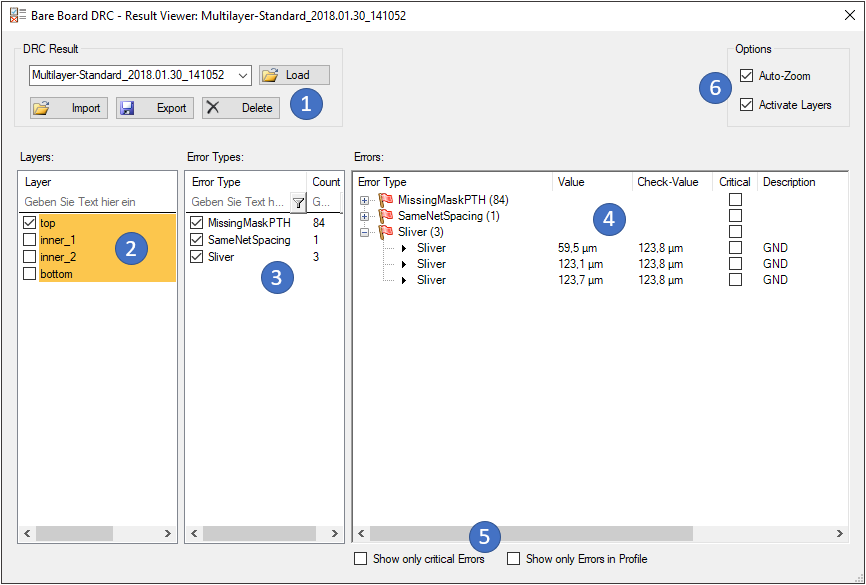
Load an available DRC results from the list or import an archived result (xml file) from your computer. With the 'Export' button you can archive the loaded result as xml file to any location on your computer.
After having loaded one result, you get a list of analyzed layers. Layers are only shown, when they contain any DRC violations. Please check one of the layers to see the error categories.
Here you get a list of error categories including the amount of violations on the active layer. Multiple or all error categories can be selected at the same time.
This is the list of real violations of selected error categories on this layer. Some violations are grouped together, when they belong e.g. to the same smd geometry or via pad stack. The measured value and the check value are shown in additional columns. Each violation can be marked as 'Critical' by the user. This information is stored back into the result file and can e.g. be used to choose violations, which should be mentioned in the 'Extended Design Report'.
These two filters can be applied to the list to reduce the visible violations to critical errors or errors situated only inside the PCB profile area.
The 'Auto-Zoom' and 'Activate Layers' options are used, when clicking/selecting one violation from the list. If activated, PCB-Investigator zooms to the region around the selected violation in the main drawing area