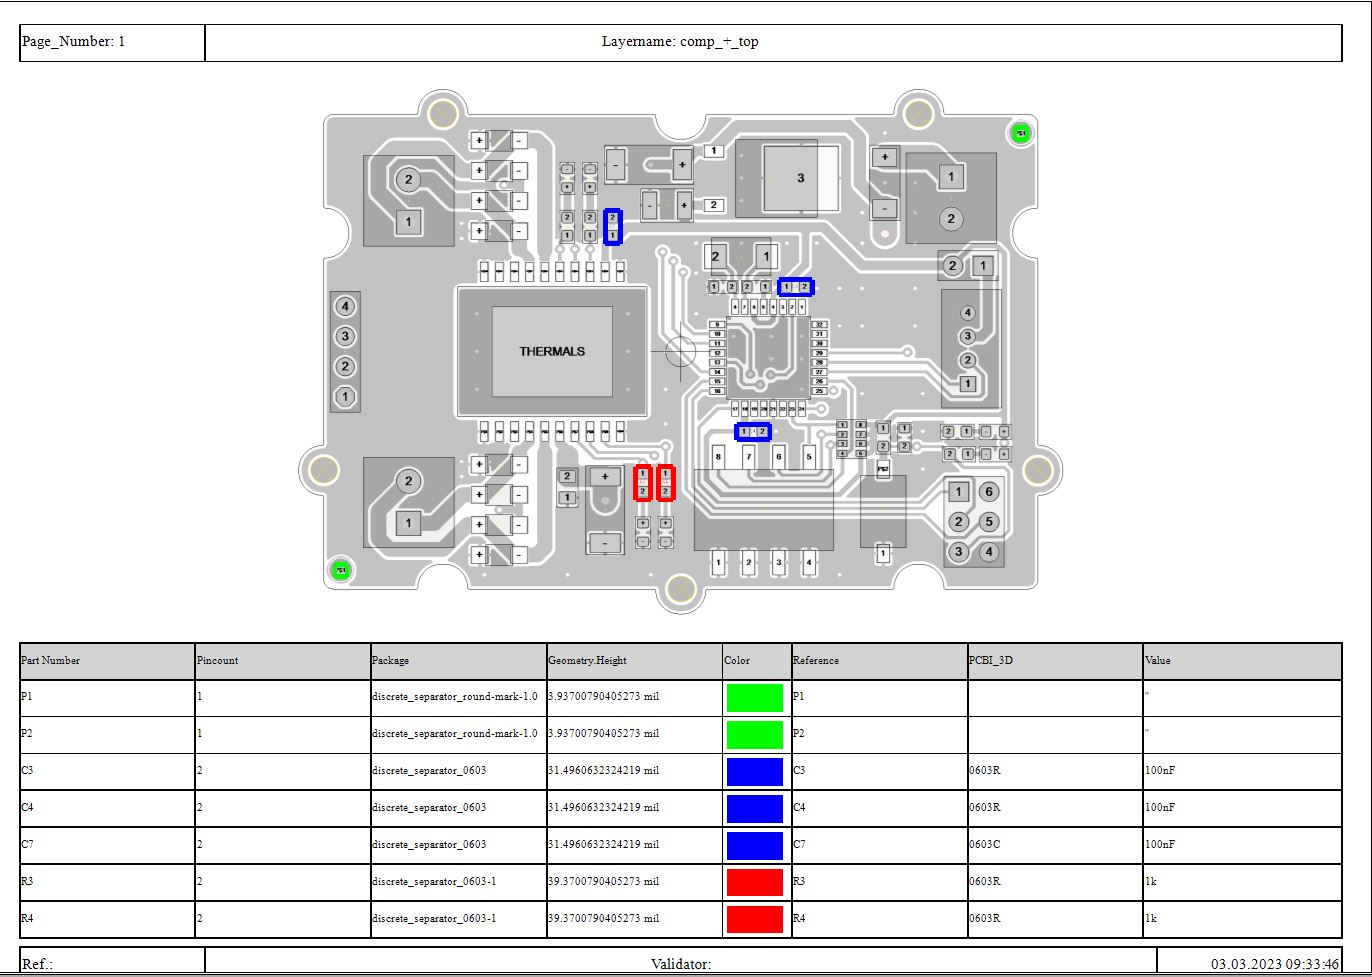
The Component Report in PCB-Investigator is a useful tool to get a summary of all components used in the PCB. This can be very helpful to make sure that all required components are present on the board and to make sure that they are placed and wired correctly.
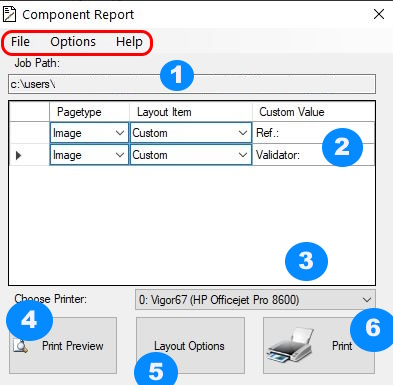
1. The path of the currently loaded job is displayed here
2. The window is for customizing temporary field contents of the layout.
All items of the layout type "Custom" are listed here. The changes are
only temporary.
3. With this button you can choose your printer
4. With this button you can see the print preview
5. At "Layout Options" you can set the options for creating the layout.
More about this in the following paragraph.
6. The Last Button is for printing your Component Report
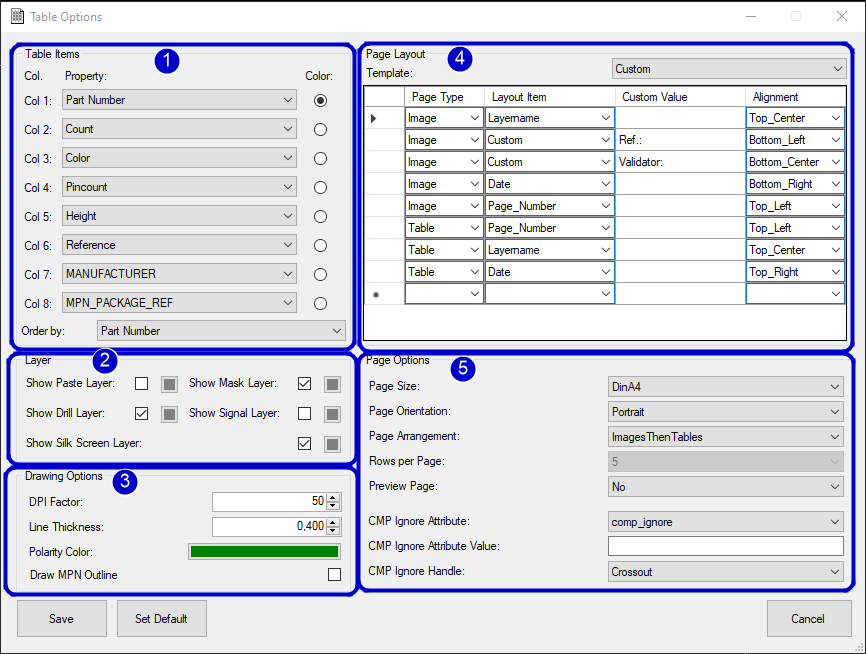
1. Tablepartitioning sets which attributes/properties of the CMP should be listed and which attribute/property should be used for coloring (Component with same attribute value get same color)
2. Layer options gives you the possibility to display different layers during printing
3. Drawing Options can be used to change the color or thickness if you like
4. Layout of the side is used to create your own page layout and can be extended as you wish.
Pagetype: Image or TableCustom Value: Will only be filled if the item was set to Custom before. Values filled here will be saved in the layout.
Alignment: Used to determine where on the page this element should be placed. Same alignments lead to the fact that these are arranged afterwards under each other.5. Page Options gives you the options in which paper format to print. In addition, you can select how many lines of the table should be displayed on one page (0 means that the table will have its own page). Furthermore you can sort the table by attributes and choose between predefined page layouts like:
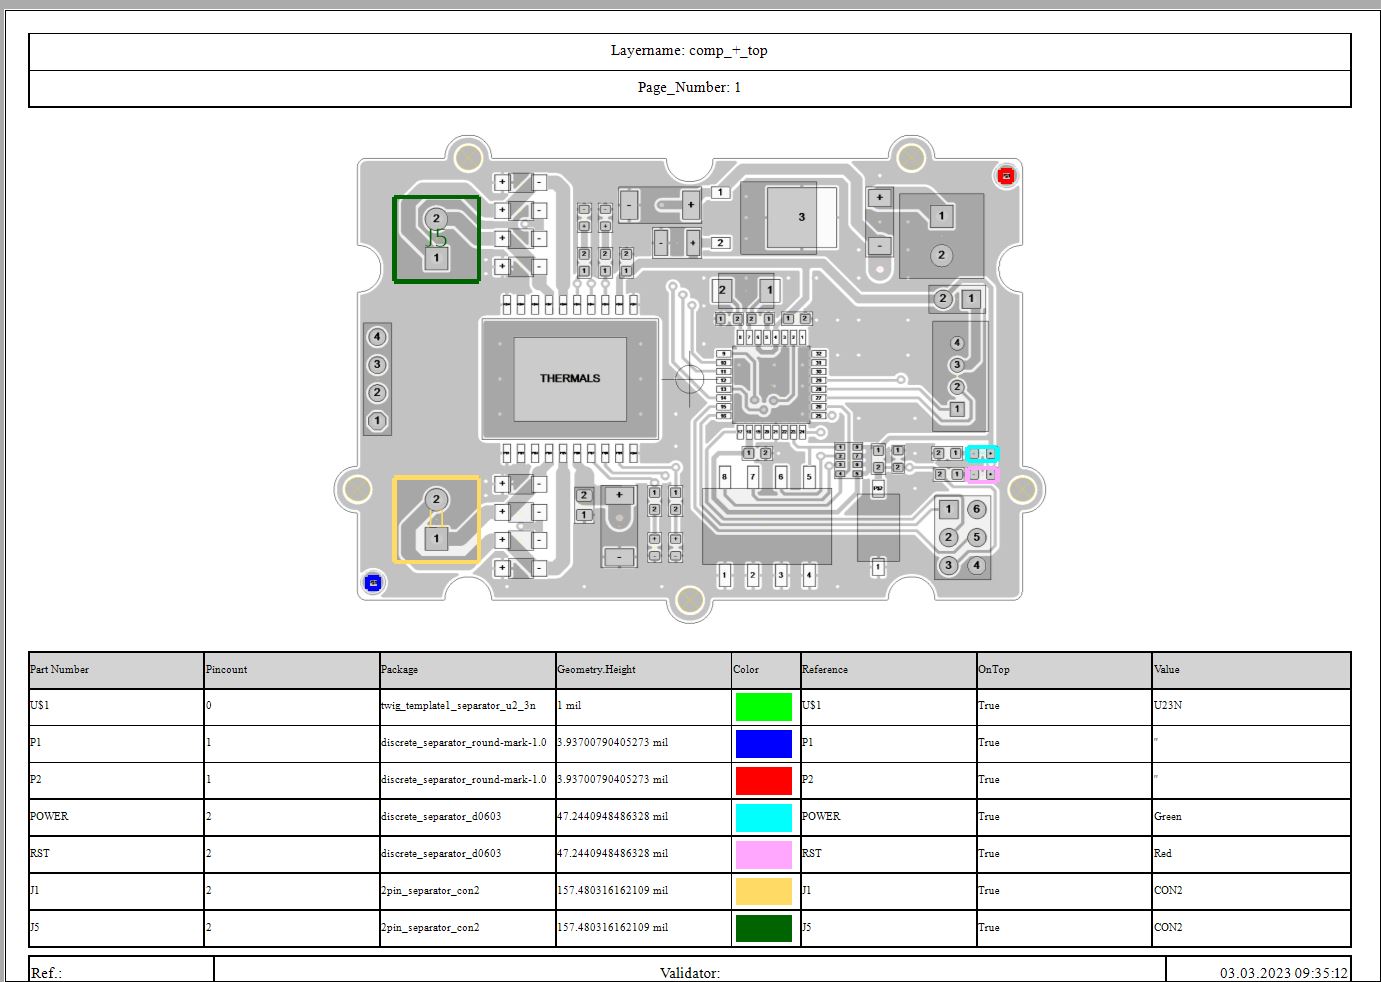
all three layouttypes are shown in the print preview at the end of this page.
Page Arrangement is Important only for Rows per page = 0 (table on extra page)
It is possible to ignore components with different options to hide them or crossout them.
Testcoverage Report use the results of machine analysis for reporting the test efficiency and production yield for the complete PCB.

You can use AOI/AXI Analysis and DFT Preperation to generate machine results to include them in the testcoverage calculation.
All saved results possible to select for single machines, depending to the machine you have some filters e.g. AOI THT machine use only results with THT filter off.
In the Overview you find some tab pages, at the end the Test Contribution Chart shows you which machine has how much influence on the check:

On the left side you can change the PPVS selection to display the diagram for the selected type.
1) how much components not tested
2) multi machine tests mean components found in more than one machines result (e.g. in AOI and ICT results)
3+4) AOI SMD and AXI have here 0 %, because the results overlap with other machines and included in 2)
5) ICT has some component only tested by this machine.
The report is stored in Extras, in the dialog you have some options:

1) Select output format (interactive html report or MS Word file)
2) Output unit (mm or mil)
3) For many Analysis results you can filter "Only Critical" results
4) Create the Export File
Here is an example how the report can be organized, with extra tab pages for each exported analysis:

The report begin with an overview for each step with e.g. design size, component count and the stackup information (signal layers, step count, layer count, net count,...)
With the extended design report you can use customization to change colors and images, you can also add own reports and pages. The report has an open Interface to automate it and create complete reports for all made analysis/checks.
Here is an example extended design report:
To create a new project, start the Part Explorer in PCB-Investigator (1) and click on "Project" > "New..." in the upper left corner (2).

Now you can see the Project Manager. You have the possibility to create several subprojects for your new project. This can be useful if you want to produce different designs and consider quantity discounts for the used components. To create a new one, please click the "Add"-Button (1).

Choose an appropriate name for your project (2) and specify how often the PCB should be manufactured (3). The components on your design will later be multiplied by the number of PCBs. For each project, you can decide whether to load the parts from the open design or import a BOM (4).
Click on "Create" to create the project. When you have created all the sub-projects, click on "Prepare >" to merge the sub-projects and start the Part Expert (5).
With the Query Builder you can easily define suitable queries for your parts. First select your MPN property according to which the components are grouped (1). If you specify a global description property (2), this will automatically be assigned to the parts that do not have an MPN property (see first row in the screenshot for example). You can always adjust the query manually in the left pane. Optionally, you can specify a Manufacturer property (3).

To customize individual search queries, select a corresponding entry. On the left, you now have the option to choose between "MPN" and "Description".
MPN
This type requests exactly one MPN in the selected libraries. You can select the part number, a specific property or free text input.
Description
In this case, a compound string is sent to the libraries. You can use the Description Builder to select the properties that make up the string. If you have good description properties in the design, it is usually sufficient to select this description property.
To complete this process, click "Continue" afterwards.
The Part Expert essentially consists of the following six main areas.

First, you need to specify in which libraries to search for information. To do this, select the "Add Library" button in area (1) and choose a library to add.

Now you can query the selected libraries by clicking on "Start Request" in area (1). In the brackets behind you can see how many Search Queries are selected in area (2).
To assign found parts, either double-click on the desired result in area (3) or right-click and select "Assign Part(s)...".

Then you need to specify how many components you want to assign. If there is a minimum order value you cannot assign less than this value. Click "Save" to assign the part. Above area (6) you can see the indicator how many of the required parts are already assigned.
To get summary information about specific search queries, you can select multiple search queries in area (2). Now you can see under "Assigned Parts" all assigned parts to the selected lines as well as information about the required and already assigned number of parts.

To subsequently adjust individual search queries, right-click on an entry and select "Edit Search Query..." from the context menu.

You can now adjust the request type and query for this entry. By clicking on “Save” the changes will be applied.
If there are already entries with the same search query and the same request type, you will be asked whether you would like to merge the entries. In this case, component references, alternative parts and assigned parts are merged into one entry. Part information that has already been queried and assigned parts of the renamed entry are always lost when adjusting a search query.
In the main view you can see at the bottom left (see picture "Project Summary 1") the total costs for your project as well as the maximum delivery time for all assigned parts.
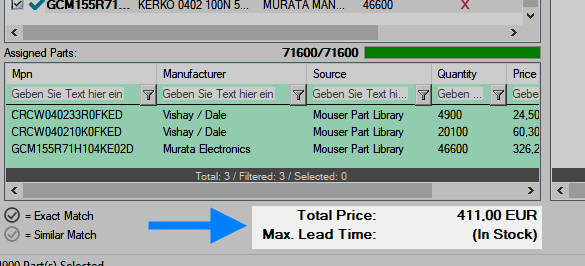
At the top right (see image "Project Summary 2") you can see how many percent of the total required components have already been assigned. This way you always have an overview of the project progress.

Custom Layout
HeaderFooter Layout
Crossout of Ignore Components
TopLeft Layout
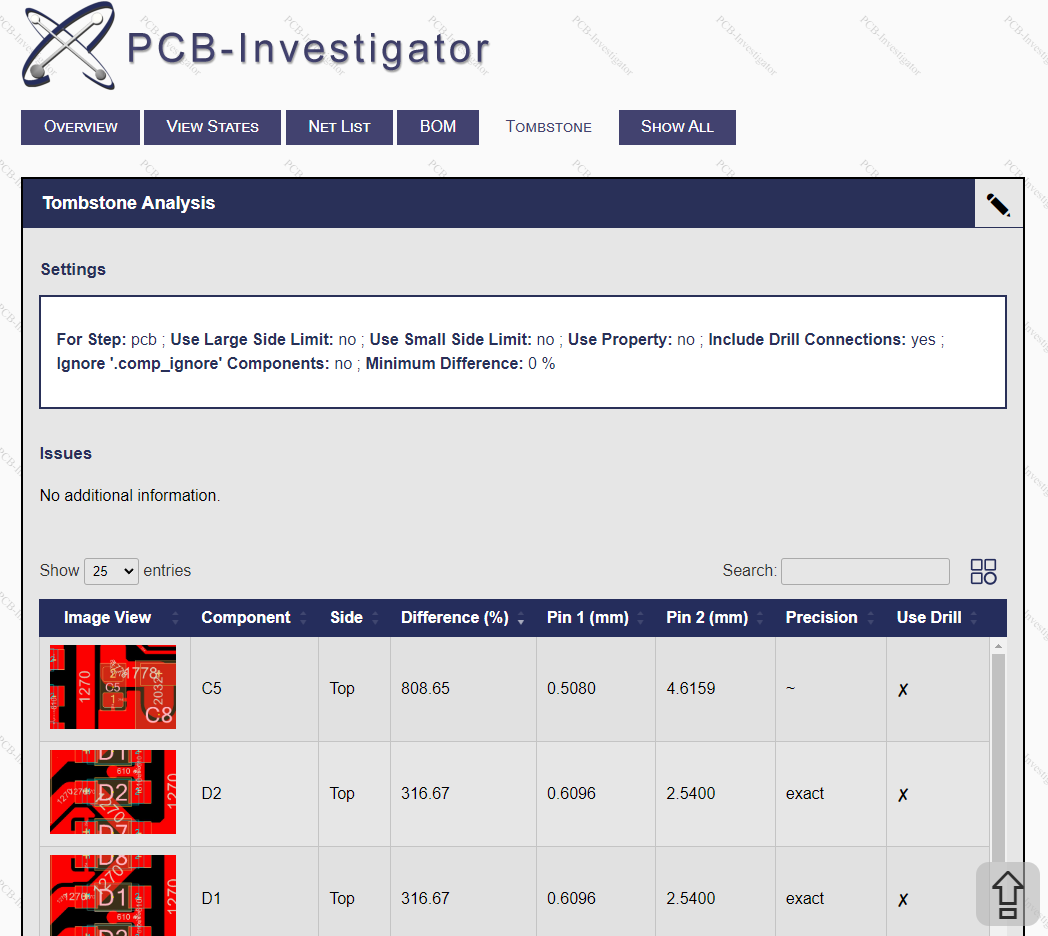
The Tombstone Result can be added to the Extended Design Report, this has options to export only critical errors (after review them). Or all result entries. It contains all important information and an small image for the component and the connected copper.
Here is an example how it should look in the HTML Report:
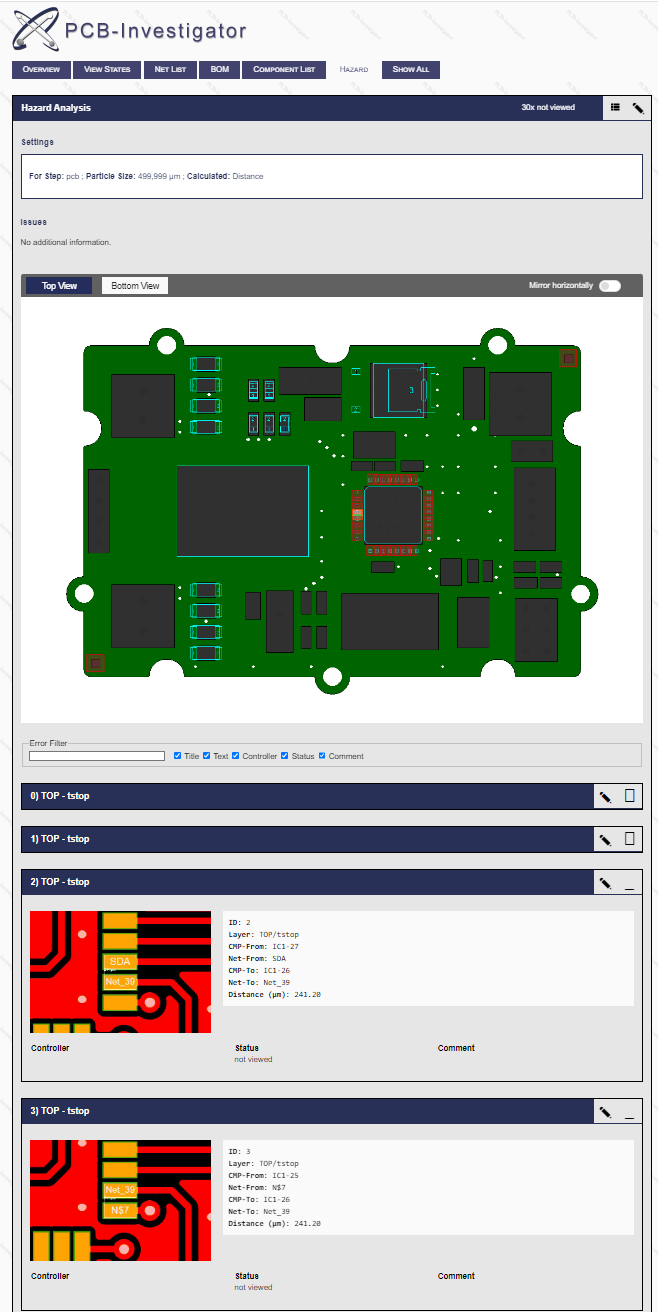
After running hazard analysis it is possible to add the result to the extended design report.
You can filter for critical results and modify the result entries with controller, status and comment. In the top area you see the used settings and an overview image for both sides with links for jumping to the connected result with image and result details.
The html report entry looks like this example:
After saving the DRC Analysis result, it is possible to add it to the extended design report. If you make an review of all entries you can filter for critical entries to make the report smaller. It is possible to check the ruleset in the HTML Region at the top and individual foil rules below (in this example the layer top has different rule).
All errors have an linked image with some informations depending on the error type (e.g. net names, distances, area,...), it is possible to add comments and status to each result.
Here is an example output:

After saving the DFM Analysis result (for each type extra), you can export it in Extended Design Report with option to filter for critical results.
Each Part of the DFM analysis has an extra drop down area with own table, comments and results.
All THT, Fiducial, Badmark, Testpoint, Paste Pad and Trace Under results in the report have additional information like status and an preview image.
Here is an example report:

Watch our PCB-Investigator - DFT Preperation Video here:
Tutorial: DFT Preperation & Machine Export:
For a quick start, download the following project with an exemplary class structure, which can be used to create a ready-made example report.
Click on the link to download the project: ExampleHTMLReportProject.zip
\bin folder.ExampleReport.dll to the PCB-Investigator (Beta) plugin folder1).For debugging to work properly, the following additional steps must be carried out.
bin\Debug folder of the project. If the Debug folder doesn't exist simply create it.PCB-Investigator.exe file located in the bin\Debug folder of the project.bin\Debug\PlugIn folder.You can now start porgramming and customize the report to your needs. The starting point for the embedded report is the ReportPlugin class. It implements the IPluginReport interface which provides the methods that are called by the Extended Design Report. This also includes the method that returns the actual HtmlReport class to the Extended Design Report. More information on the individual classes of the Example HTML Report can be found in the next section.
When you are finished programming the report, simply repeat steps 4 and 5 from above. You can also create a post-build process to automate step 4 if you wish.
bin\Debug* folder of the project. (* or the folder corresponding to your build configuration)You can now start programming and customize the report to your needs. The starting point for the standalone report is the ReportCreator class. More information on the individual classes of the Example HTML Report can be found in the next section.
1) PCB-Investigator (Beta) plugin folder: C:\Program Files (x86)\easylogix\PCB-Investigator-Beta\PlugIn
Used interfaces: IHtmlReport, IHtmlReportNoHtmlExtension
Purpose: The actual report class responsible for displaying the html page.
Provides the following methods:
OrderNum: The order number of the report in the list of reports. Use OrderNums.DefaultFirst or OrderNums.DefaultLast if you don't care about the specific order. Otherwise, use a number to define the specific index of the report.GetHtml()GetCss()GetJs()GetReportData(): Define basic settings like the title of the tab and settings for the main window.TryGetChildReportTitlesByReportId(): Used for help links in report windows when combining multiple reports in one tab. Note: May be deprecated in future versions.Introduces a new method:
GetHtmlData(): Replaces GetHtml() and expects a list of IWindowContentData objects as a return.Represents all template data that can be defined at the first level within a window.
Predefined standard templates from the Report Tools that reference a template file from the default report templates library. Users only need to add their own data.
Standard container consisting of a template and corresponding data. Allows inclusion of custom templates using dotliquid syntax.
An abstract class for template data that allows defining further sub-templates within the template. Enables flexible combination and nesting of templates.
Creates a report window. Can be used to define additional sub-windows in the main window of a report.
Simple container without styling, used to group templates. Custom styling can be applied using a definable CSS class.
Simple container without styling but with a title. The title is separated from the container with a line. Particularly suitable for displaying simple information text.
Used Classes: ReportCreatorRevised, ReportHelper
Purpose: A class for creating a HTML Report without UI, purely via code
ReportType => Defines which customization file is loaded.
Used interfaces: IPluginReport, New: IPluginReportMultiType
Purpose: A class for integrating an HTML Report into the Extended Design Report (or new: Testcoverage Report)
GetHtmlReport()
HtmlReport class mentioned earlier.GetHtmlReport() methodIsReportIncluded() method
Purpose: Class for intermediate storage and bundling of all relevant report data.
This class should be used to collect all required data. Similar to a DTO, it is helpful, among other things, to keep the constructor of the HtmlReport manageable.
Purpose: Class for global constants.
This class is intended to serve for the clean separation of constant values from the rest of the code.
The following is a list of all the HTML templates currently available in the Html Report Tools Library.


Note: All resource files (.js/.css/.html) must be included as Embedded Resource so that they are present in the .dll.
For simple changes on the report like colors or company logo you can change the settings, here is a instruction document:
customization_html_reports.pdf
The Html Report Tools are built on the DotLiquid library. This means that the syntax used to create templates is the liquid syntax. This must be used in order to create your own templates and fill them with data. Below are the links to the documentation, both from DotLiquid[1] and from the original Liquid Library from Shopify[2]. The latter has a more comprehensive list of the usable syntax and appears to match the DotLiquid syntax.
Watch our PCB-Investigator - Graphic Board Compare Video here:
Tutorial: Graphic Board Compare:
Watch our PCB-Investigator - Database Compare Video here:
Tutorial: Database Compare:
Watch our PCB-Investigator - Instance Sync Compare Videos here:
Tutorial: Instance Sync (CAD data)
Tutorial: Instance Sync (PDF document)
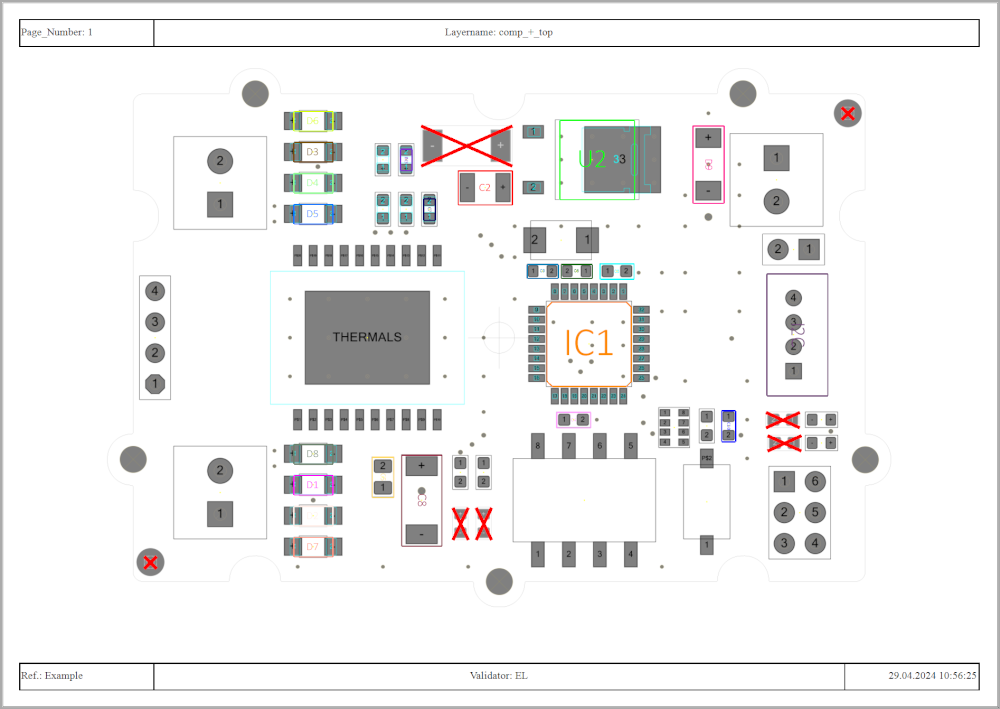
You can select multiple different settings to adjust the view quickly.
![]()
From left to right they to the following.
By right clicking the component list you can export the current view to and Excel or HTML file.

There are multiple statistics about the design that can be easily viewed in the lower right hand corner.
In total there are 6 different statistics that can easily be accessed inside of the different tabs.
The first tab shows the amount of top and bottom components that populate the board as well as the amount of pins on the board. Furthermore you can see the statistics also divided depending on the mounting type of the component.

The next tab shows the different packages that are used and how often they are used. Starting from this statistic you can choose between a bar chart or a pie chart with the radio buttons below the chart.


The next tab does the exact same just sorted by the Part Name instead of the Package.
The height tab looks at the different Heihgts that are present in the design and displays them.
The tab called "Has Value" inspects how many components have a certain property. You are able to select the different properties and find out if for example all components have a "MPN" property.
The Sum up Tab does the exact same as the sum up function inside of the Property List, but in the form of a bar or pie chart.
The Design History shows all important actions for the current design.

Here is an example for an deleted object.
With the PCBI Documentation Plugin it is easy to generate images for reports or documentation.

There are many options to generate your image:
Black and white: Change colours for all layers to a greyscale image
Draw Copper Layer: Activate the top/bottom copper layer
THT/SMT/Pressfit/Other Components: Filter the technology type of the components
Fill Components: Allow to switch between filled and outline drawing for components
Draw Outline: Option to show board outline
Draw Size: Display ruler for width and height of the PCB
Draw Mask/Paste/Silk Screen Layer: Activate the layers with specific type
Draw Board Color: Option to fill the outline
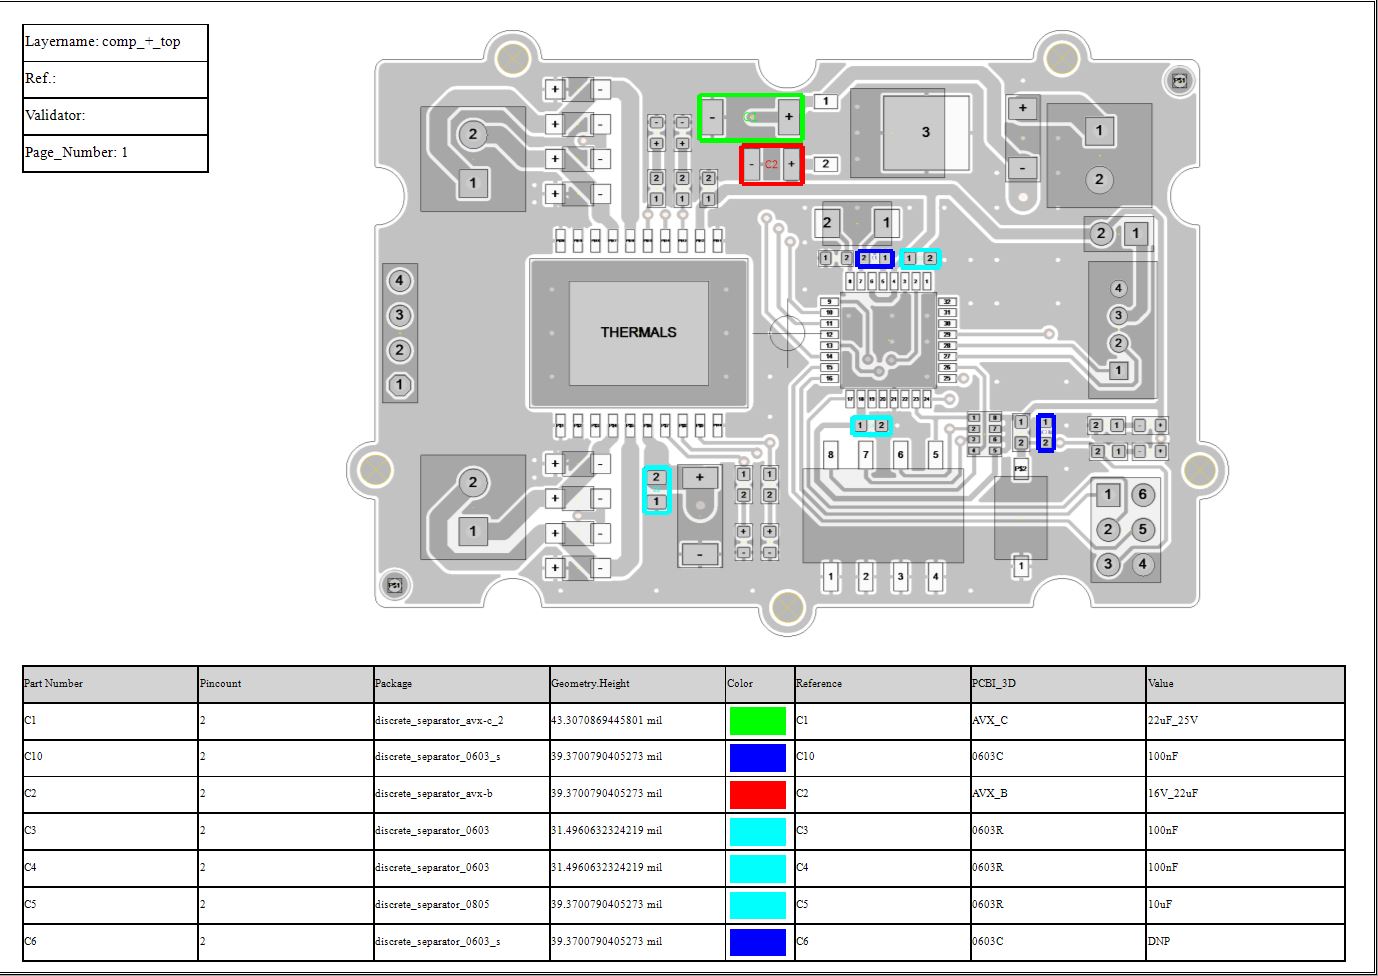
Draw MPN Outline: For additional Part/Package information they are shown extra (in the overview image with Cyan)
Custom Layer
There is an option to define your own layer list/Views and Synchronize with PCB-Investigator

And the Real View option, this define fix views as realistic image for your virtual twin.

Production panels perfectly utilized with Panel Optimizer

Create perfectly utilized production panels with the Panel Optimizer tool! Stop wasting expensive space and optimize the arrangement of your in-house panels for the final production! This will not only enable you to significantly reduce your production costs, but it will also speed up your time-to-market. Panel Optimizer automates the process of arrangement and therefore helps you to quickly find the ideal solution for your individual requirements.
In addition, the newly integrated traffic light system instantly indicates the actual capacity utilization of the production panels. At the same time, our optimization suggestions point out to you which changes of your panels can benefit a perfect utilization of the production panels. This enables you to find the best possible and most cost-efficient solution!
There are two ways to use Panel Optimizer:
1. Start the tool directly and input data directly (design size)
2. Start the tool out of PCB-Investigator, it gets the sizes and meta data from there and has an image with panel information
Here is a video how to use the tool:
The importand formulars for test coverage report are:

We use the parts per milion values (PPM) for precense, polarity, value and soldering per pin to sum up all results and devide them bei the sum of all PPM values.

The production yield is only depending to the parts per milion values (PPM), it is the product of all "bad parts".
The top block of the machine page in the report containing some important values:

Components Checked: Percent how many of possible components are checked with this machine e.g. the AOI is placed after SMT soldering and cannot check THT components. If some of the components in shadow of other components the value is lower then 100%.
Covered Components: This is the positive result with higher coverage value then 0, this value gives you a short overview like a table filter >0.
Pins checked: Maybe the machine cannot check all pins, the percent value is depending on the machine type and analysis results e.g. a AOI machine cannot check cooling pins under the body of the packages.
Covered Pins: This is the positive result with higher coverage value then 0 for the pins.
Coverage Presence/Polarity/Value/Soldering: The overview value for all results or "-" if the machine cannot check this value.
Net Access machines support electrical tests for value and need testpoint definitions. In general this is results come out of the DFT Preperation see DFT manual
At the top area there is a overview:
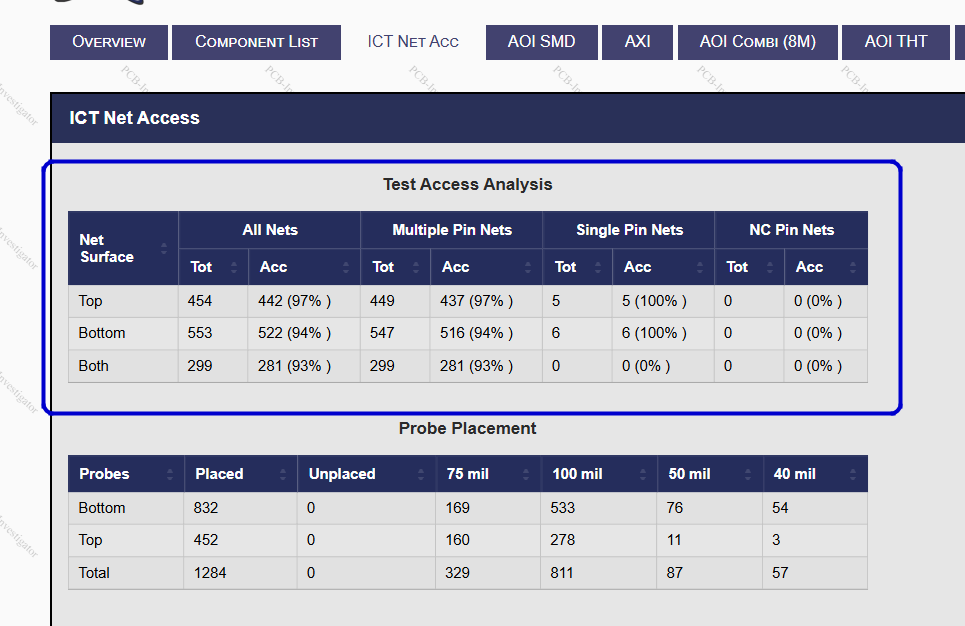
The Test Access Analysis gives you an overview over all possible net contacts. The entries contain optional probes from the DFT session.
In the Probe Placement there is a overview of defined probes for the machine exports, this contains only forced probes no optional/alternative probe settings.
To open the Machine Organizer use the Edit menu and click on "Machine Order".
You can organize your production street with different machines:

1) Use default machine order with SPI-, AOI-, AXI-, ICT-, BScan- and FPT-Machines
2) Add new machine with own settings or from the template list.
3) Remove selected machine from the machien order list.
4) Move selected machine to the left.
5) Move selected machine to the right.
6) OK close the dialog and save the new machine order.
Each machine should be configurated with parameters to start an analysis and get check information from there. E.g. you can have an AOI machine which can test some components found in the AOI Analysis, or you have an AXI machine with specific settings (e.g. test only BGAs and DPack components) this creates an analysis result and the machine definition define the machine connection to the test result. You can start the analysis for each machine directly with the small button beside the drop down "Selected Result".
Each Machine has specific options , you can open them in the context menu of the machine:
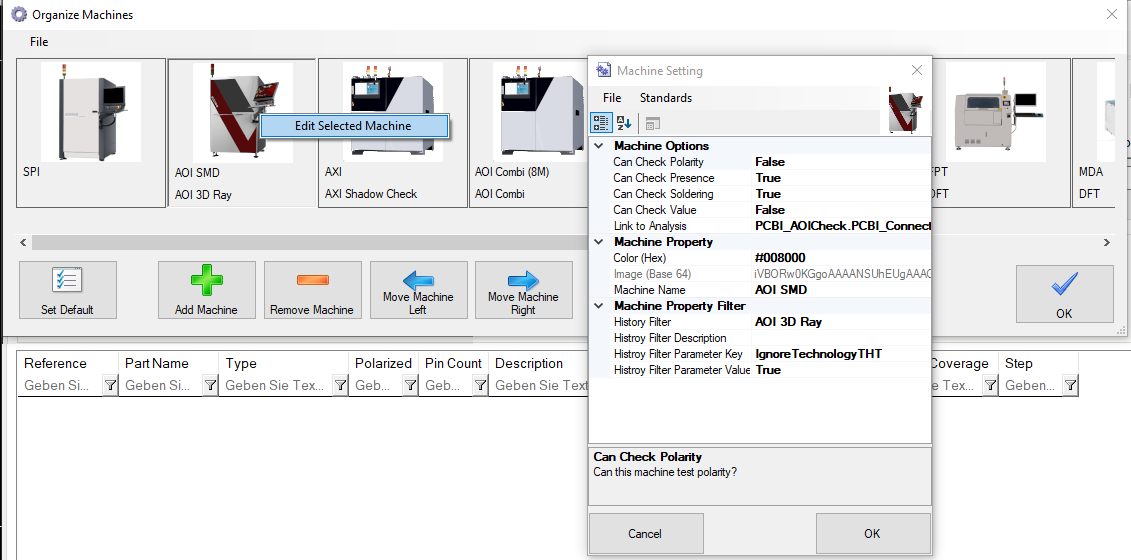
Each machine can check Polarity/Precence/Soldering/Value individually.
Use a Link to Analysis for direct opening the connected Analysis which results are readed from the history.
To filter the History and find the connected Results there are some Filters e.g. the name of the machine and maybe specific filter (here Ignore Technoloty THT = true).
Depending on your production quality, the PPM values for the production line defined in the Options.
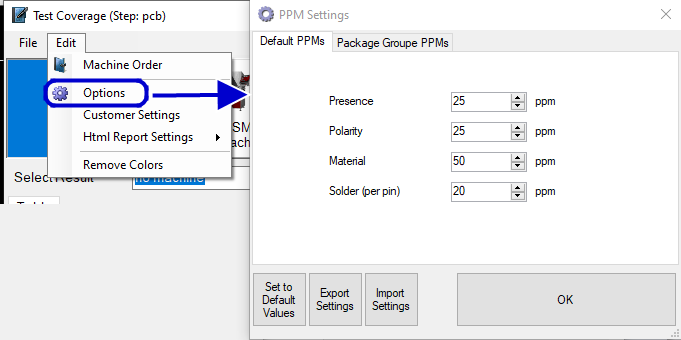
You can Modify the default values or set specific defect values for each Package Group e.g. your Chip values better like QFN soldering then change the PPM value for one Package Group. This values modify the Porduction Yield directly and the Test Efficiency in small parts (see calculations above).
With the option "Calculate values regardless of the capabilities of the machines" the percent values has the same basis (real PCB data) or use the machine results for calculation (e.g. only checked components of the analysis result like count BGA + QFNs in AXI analysis).
We are working on new features, for beta users here are some details:
1. Easy switiching active machines:

2. Summary in single Machines:

3. Summary in Overview Tab:

You see some special cases e.g. for Polarity the machines do test some components without polarity marker this means you have more tests as needed.
For Value tests you see the machines check 84 of 96 components, but the design contains 205 relevant components. The machine results are ok with 87.5 % but for the complete board this is only 40.98%
The Coverage Score is a helpfull scoring value to compare different machine settings. The calculation is Percent All (P+P+V+S)/4 without unit.
Use The Find Dialog or Search Textbox to get a overview with all found Components, nets and properties:


If you use the space key, the quick search appears and you can use some chars to filter the search results:
> search for attributes and properties on copper and other ODB objects
! search for components e.g. type the reference or a part of the reference
? search for attributes e.g. the mount type
$ serach for layer names, you can activate them or deacitvate it without scrolling in the layerlist
% serach for nets, use net name or part of them to find the relevant net and select/highlight them
Note: Quick search is available in V17 and preview beta version! This feature replace the old metro style menu and is available by pressing the space key on the keyboard.
In the search manager it is possible to define different search types, it is possible to add your own plugins with individual searches to the Search Provider List.
Default there is a web serach, a part search and a package search. In each of them it is possible to add additional serach properties to e.g. search in a different library or serach for customize properties.

The Search for... Context menu is on many places available (nearly each list view supports the serach), you can directly start e.g. a bing serach without copy the property or check for existing MPN on your favorite website.
For more information how to customize the search contact support@easylogix.de
Work Instructions
Auto-fill Word templates with PCB project data
Generate dynamic images, tables, and text
Create consistent, reusable manufacturing documents
Handle special individual wishes with scripts

Define a Word Template (or auto generate it depending to your settings), easy switch between different templates!
You can define images as standard formats (e.g. png, jpg or bmp) or create vector images. Use Tables with attributes and properties or simple text replacement.
For special fill actions it is possible to use scripts, you can define a default script in the settings dialog and modify it depending to your needs.
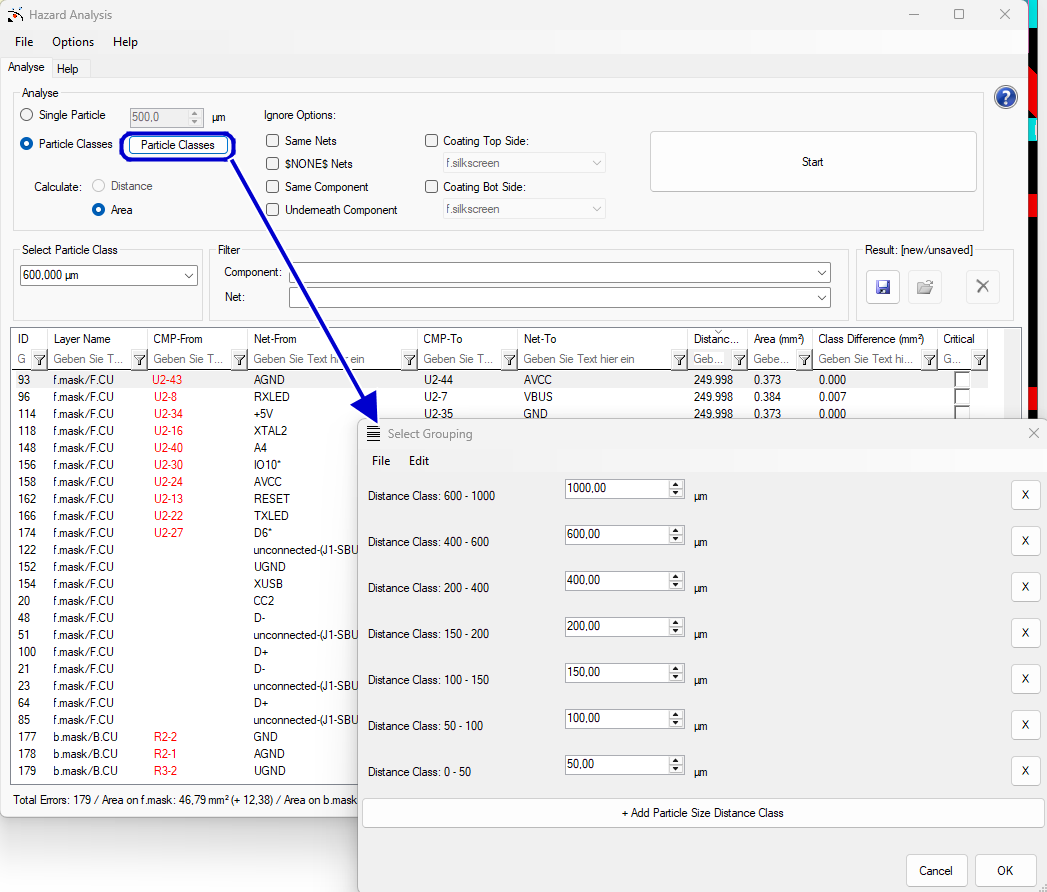
Hazard Analysis supports ZVEI Particle Classes with batch calculations.
You can define and modify the particle classe grouping in the select grouping dialog with options to add, remove or modify the distance classes:
The Results show you the area of current particle class and compare it imidiatly with the last result (1 + 2). The result class is selectable in an drop down to view specific results (3).
In the bottom line is a compare between the current result and the last one (overlappings removed), see 4:
